Data-driven digital marketing reports are an essential tool when it comes to marketing efforts. They measure marketing performance, help you understand the value of digital marketing efforts, and evaluate progress toward your business’s goals.
Data-driven digital marketing services rely on reporting to track progress. However, it can be difficult to find important information in reports, especially if you aren’t actively tracking marketing progress every day.
Any data-driven digital marketing report should answer the following questions:
- Are my digital marketing efforts working?
- How well are they working?
- What can or should be improved to increase my ROI?
Elements of a Data-Driven Digital Marketing Report
Let’s take a look at one of our digital marketing reports to understand the components of a good report. Learn what to look for and how to read digital marketing reports your top questions.
Here are the elements data-driven digital marketing reports should include:
The Summary
Before diving into the nitty-gritty metrics, a good digital marketing report will include a summary that provides a snapshot of the business and current digital marketing efforts.
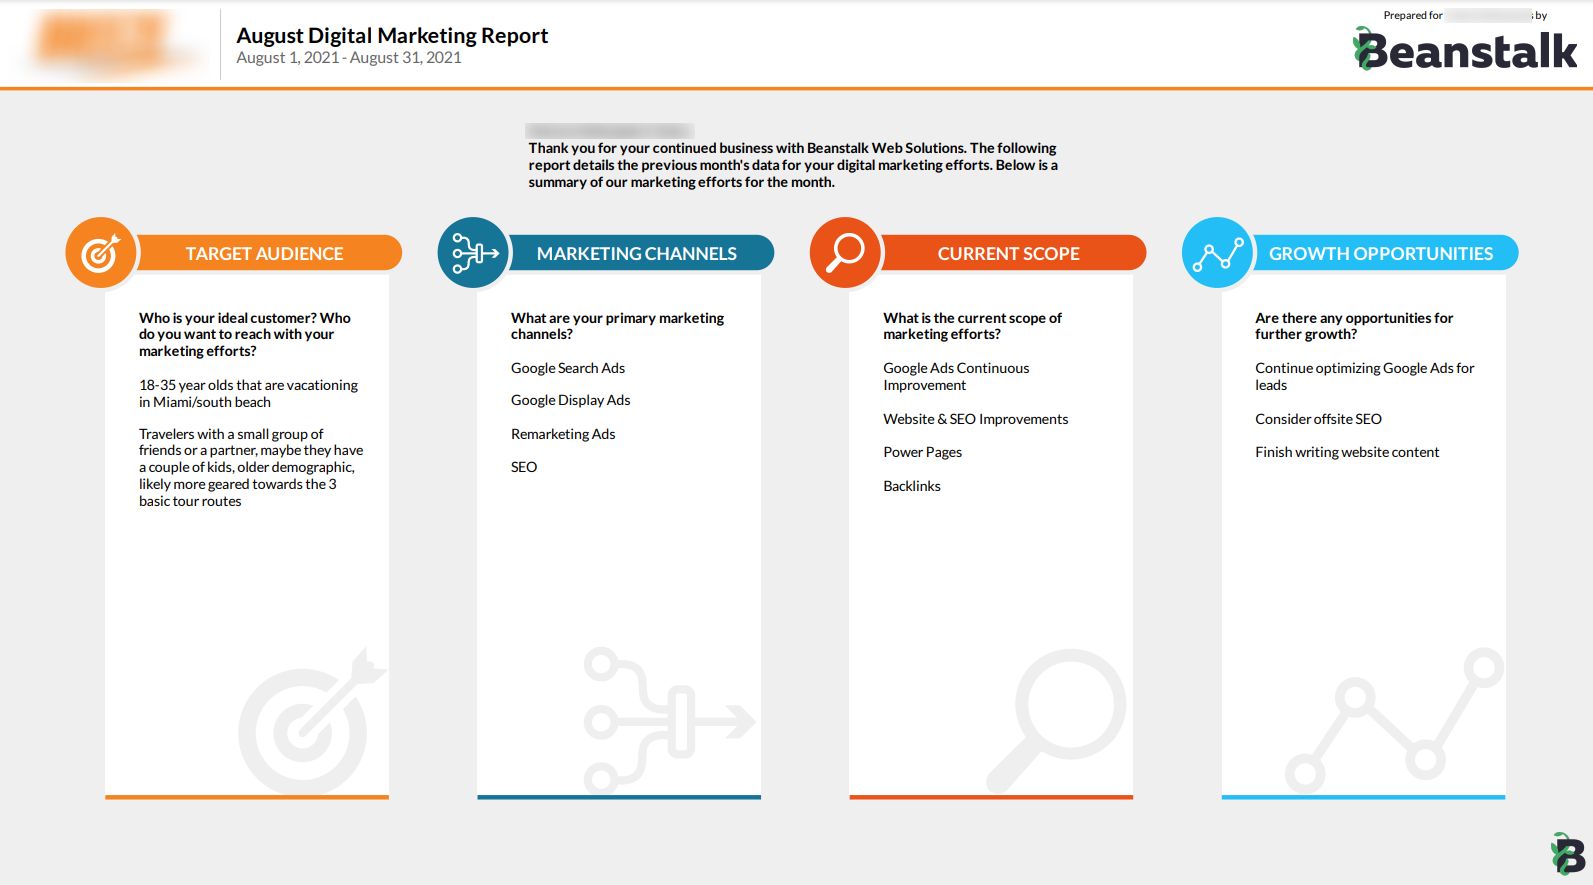
Some important things to include in the summary section are
- The dates that the report covers
- A list of the main marketing channels (Paid Advertising, Organic Posting, SEO, etc.)
- A description of the current scope of the project and what was completed in the given time period
- Information on the target audience, target demographic information, location, hobbies, interests, etc.
- A space to discuss future growth opportunities, ideas for projects, or strategy changes
A good summary should clearly break down what is being done to provide a clear picture of the digital marketing efforts for the given time period. The summary sets the stage to make it easier to digest the metrics to come.
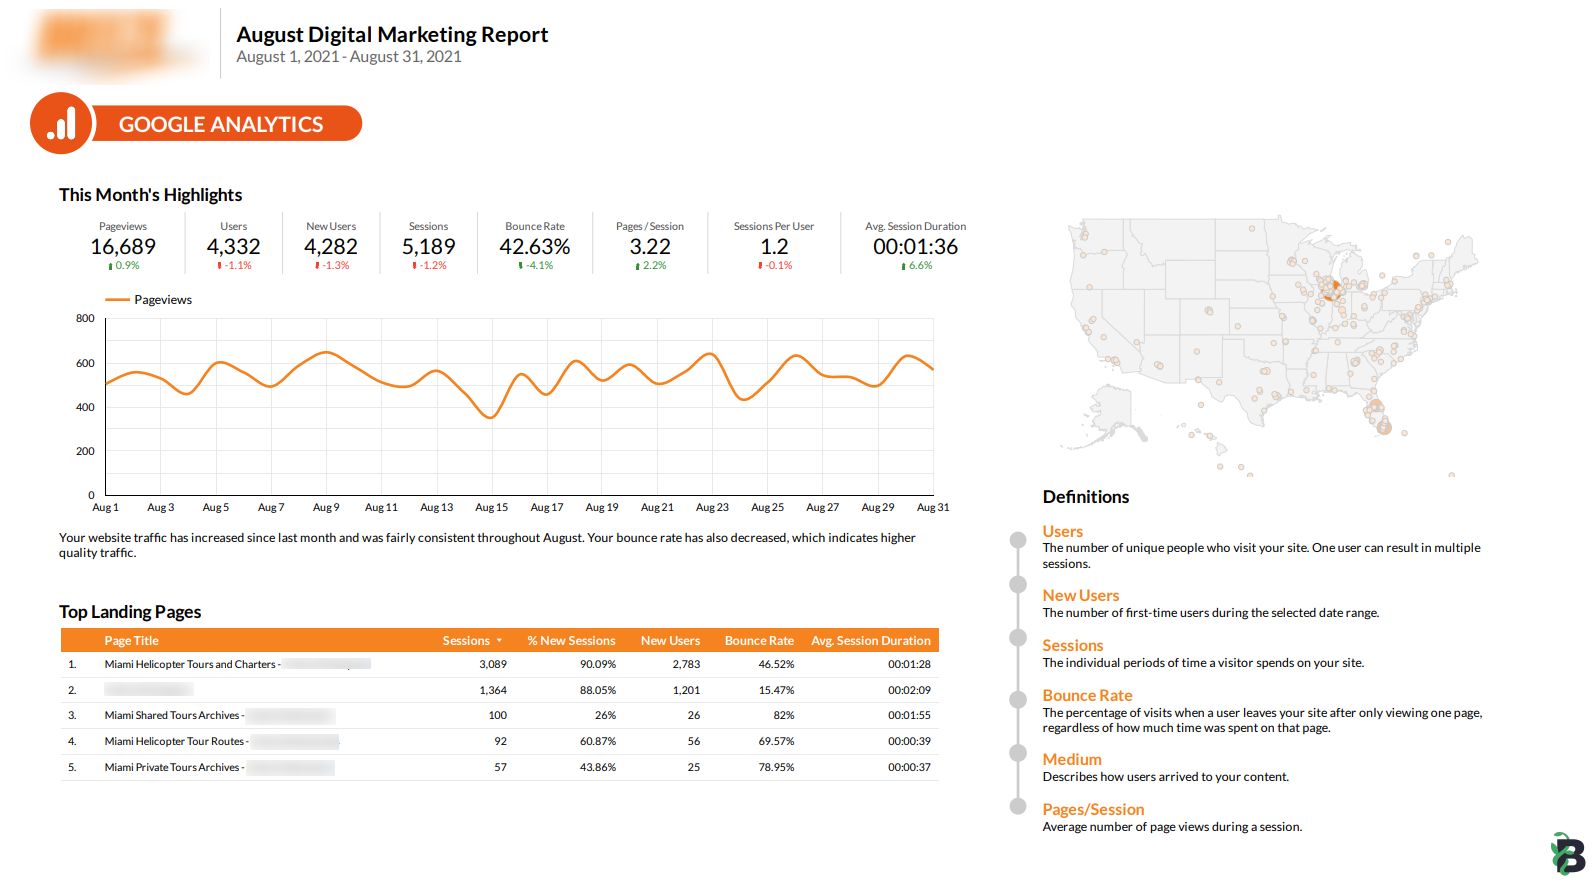
The Analytics
Nearly every data-driven digital marketing report will start with looking at analytics data to evaluate the performance of the website and marketing efforts. Our reports seek to provide information about the website’s users to try and piece together the performance of the website itself.
Google Analytics data can help answer a few main questions:
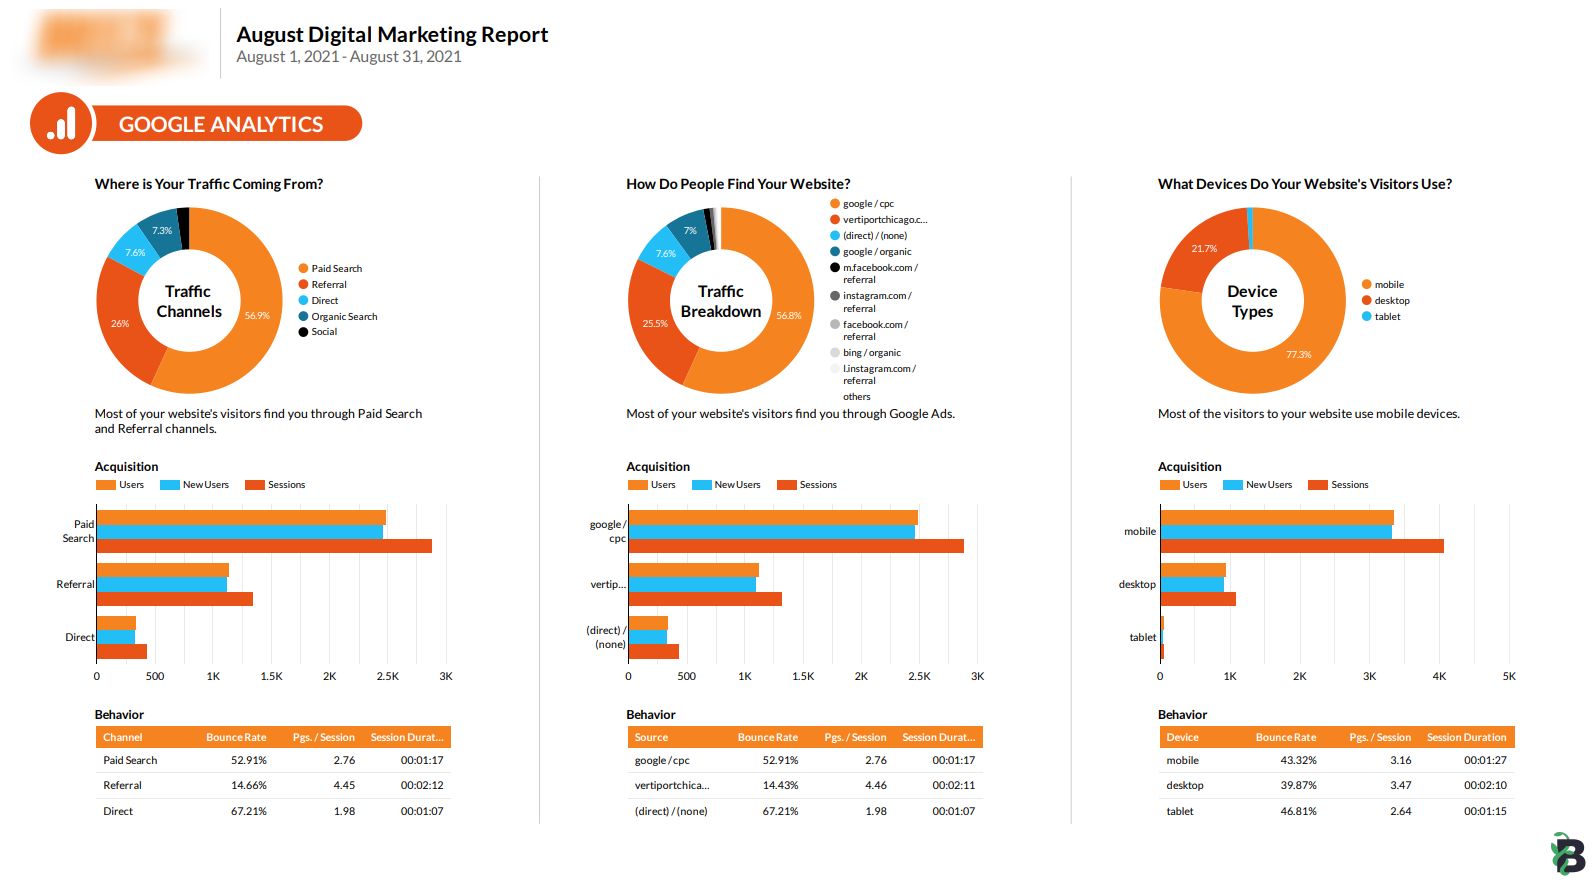
Where are users coming from and how do users find your website?
If you are investing money into marketing your website, it’s important to know what channels users are coming from. This information allows us to confirm which digital marketing efforts are working best at driving traffic to your website. The traffic channels and traffic breakdown section of our reports answer these questions.
What devices do users use?
Knowing the devices from which your website’s users visit can help you determine where to spend time optimizing in order to get the best results. For B2C companies, most of your energy should be spent optimizing your website for mobile users; for B2B companies, most of your website’s visitors will probably be on desktop.
What is their on-site behavior?
Once you’ve figured out where your website’s visitors are coming from, it’s important to take a look at their on-site behavior. The following metrics can reveal a lot about how users interact with your website:
- Bounce Rate
The bounce rate represents the number of people who leave after visiting a single page of your website, without making any sort of meaningful interaction. Ideally, this number will be as low as possible. A high bounce rate can indicate poor quality traffic that is not engaged with your content. It is a good idea to evaluate pages with higher bounce rates to see if there are any areas that can be optimized for engagement.
- Pages Per Session
Pages per session is the average number of pages a user visits on your website in a single visit. Certain types of websites, like e-commerce websites, can expect a higher average number of pages per session. The average website should shoot for around 1.8 to 4.4 pages per session.
- Sessions Per User
Sessions per user is the average number of times a user visits your website. While it is unusual for this number to be much higher than 1, a higher number of sessions per user indicates that users are engaged with your content and visit your website more than once.
- Average Session Duration
Average session duration is how long the average user spends on your website per session. Engaged users tend to spend longer amounts of time on your website. A good average session duration to shoot for is 2-3 minutes.
What pages do users visit?
It’s important to take a look at which pages users visit most often as well as those users initially use to find your website. Your top landing pages and most visited landing pages can give you a sense of what content on your site resonates with users and how users move through your site toward the desired action.
Sometimes, unexpected pages can end up being the most visited pages of your site. Be sure to optimize these pages, keep their information up to date, and make sure they guide users toward a conversion if possible. Optimize any paid ads landing pages for conversions. Learn how to optimize your landing page with our helpful guide.
Where in the world are your website’s visitors?
Especially if you offer a product or service that’s specific to a certain area, it’s important to make sure your traffic is coming from the right people. If you find that most of your website’s traffic is coming from somewhere other than your desired location, you may need to consider changing up your paid advertising targeting. You may also want to consider local SEO tactics to capture qualified leads in your area.
What conclusions can we draw from the actions users take on the website?
This is where the real analysis begins. Once you have gathered as much information as possible about your website’s users, it’s time to think about what their behavior might mean. Taking the time to draw conclusions from data-driven digital marketing reporting can help your business gain insight and take strategic actions in the future. While you may want to rely on the experts to help you draw conclusions from your data, try to pick out a few questions or insights yourself.
Marketing Efforts
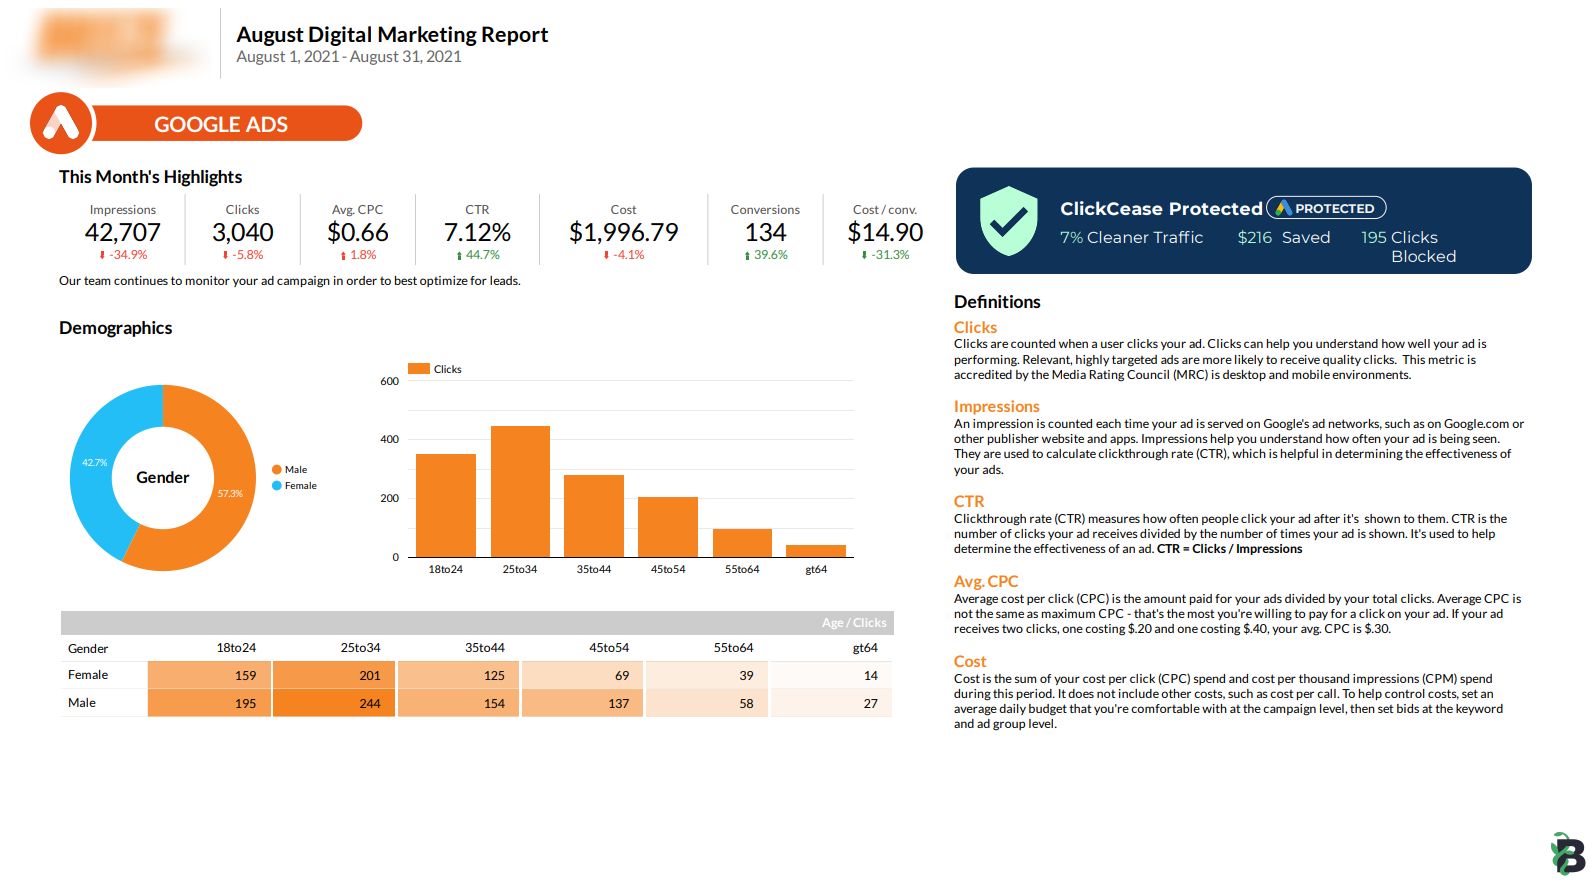
Finally, every data-driven digital marketing report should take a deep dive into the performance of all marketing efforts. Determining the performance of each marketing medium will help determine which marketing efforts are performing best, driving the most leads, and landing the most qualified conversions.
While Google Analytics alone can give us some insight as to where marketing efforts are paying off, ultimately more information is necessary to make data-driven marketing decisions.
There are several important things to analyze when determining the performance of various marketing efforts. For each digital marketing channel in your report, consider the following:
How Much is This Costing My Business?
It is important to calculate the cost as not only “how much is my ad spend” but also how much time is spent setting up and optimizing each marketing channel. Even if a channel like organic social posting is technically “free,” you will need to spend a significant amount of time creating, scheduling, promoting, and interacting with posts.
Determine a budget and goals for each marketing channel. In the first 90-180 days a new campaign goes live, you should establish a baseline of data to expect from each marketing channel. With paid advertising channels, this baseline can tell you if you should be spending more or less, or changing targeting. With organic digital marketing channels, this baseline will give you a better idea of how long it might take to achieve the results you expect. Becoming familiar with your baseline performance is important so that you can recognize shifts in marketing performance easily and quickly.
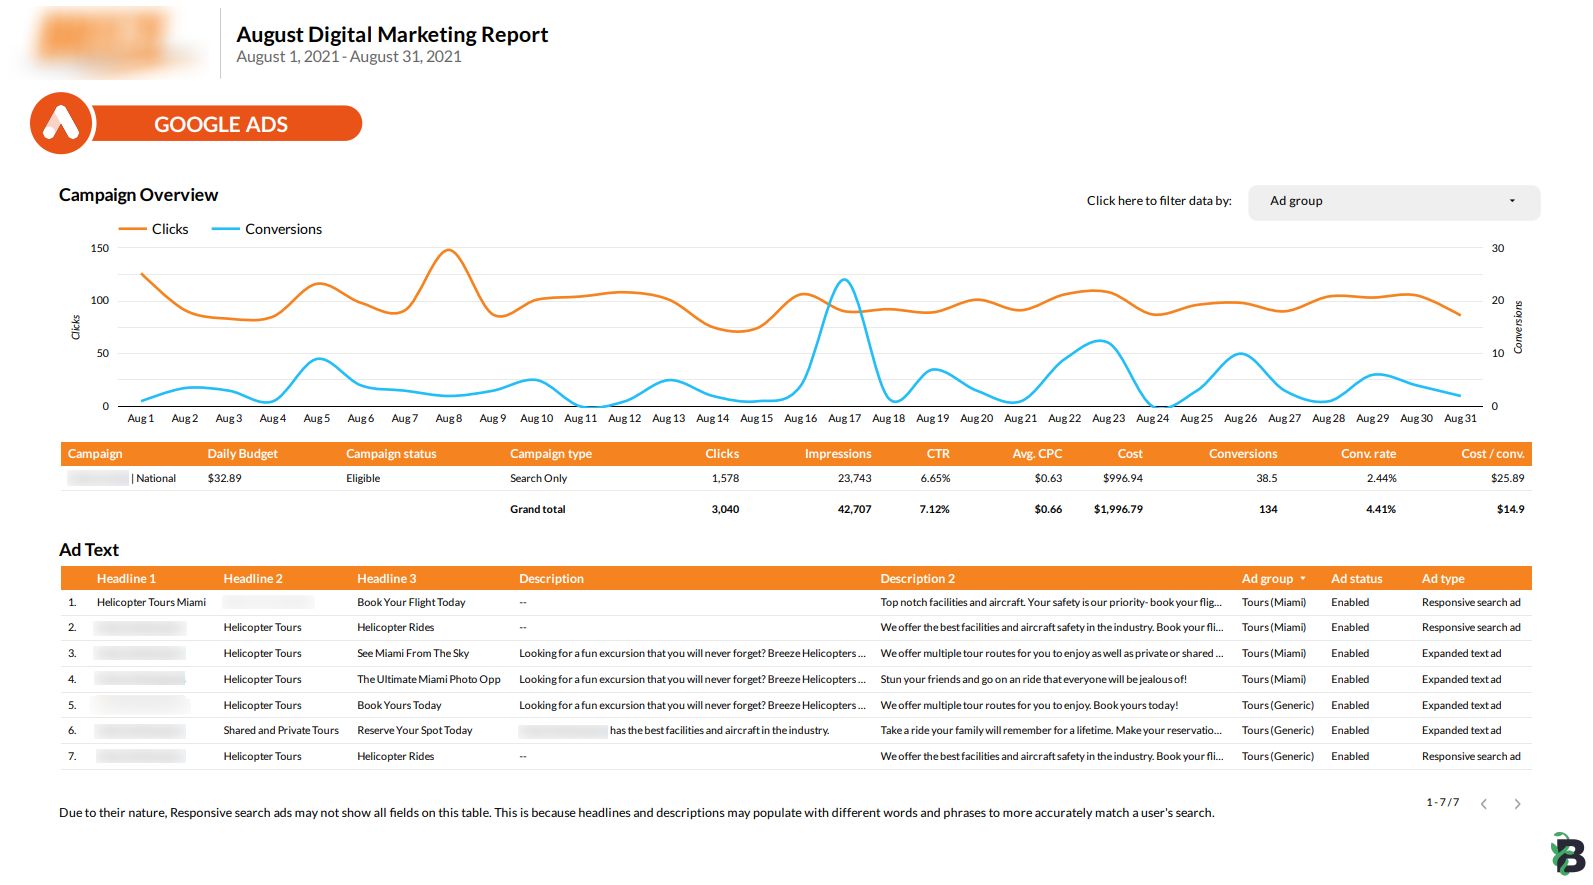
Conversion Tracking
Any good data-driven marketing reporting strategy will include as much information about conversions as possible. While other marketing metrics may fluctuate from month to month, none is as important as the conversions your business receives. For each marketing source, you should be able to see
- How many Conversions you received each month
- How much is the average conversion cost in terms of ad spend (ie. 6 Conversions / $300 Ad Spend = $50 Per Conversion)
- What were the specific Conversions Actions Users made? Did they call you, fill out a form, download a piece of content, purchase something on your website, etc?
- If possible, what information do we have about the people who completed conversions? Even tracking names or email addresses is an important part of determining the quality of each lead you receive from each marketing channel.

Conversion Quality
The best data-driven marketing strategies understand that quantity is not the most important thing. Quality is far more important.
If you’re getting 20 phone calls a month from your Google Ads, that’s an awesome start. But don’t stop there. Take a look at who those 20 phone calls came from. Which calls led to sales? Which calls led to the most valuable sales? When you take the time to understand the value of each conversion, you can make data-driven digital marketing decisions with confidence.
The value of each marketing conversion is the metric that can help you most easily answer the following questions:
- Are my digital marketing efforts working?
-
-
- Do you consistently get the number of conversions you expected?
- Are the conversions and cost per conversion generating a positive ROI?
-
- How well are they working?
-
-
- Are the conversions you receive leading to tangible sales?
- What is the value of your sales from digital marketing effort vs. the cost per sale?
-
- What can or should be improved to increase my ROI?
-
- Which digital marketing channels are bringing in the most leads and most valuable sales?
- Are you using the right data-driven digital marketing strategy for your business?
Some of these questions may be harder to answer than others. We are always available at Beanstalk to take a deep dive into your digital marketing report and provide valuable insights. Even with the extensive data that each of our reports provides, we add additional strategic insights that are essential components of data-driven digital marketing services.
Additional Questions to Consider
How Often Should You Be Looking At Your Digital Marketing Reports?
How often you need to evaluate progress depends on your industry, methods, and goals. One month is a good sweet spot for most projects. However, for long-term SEO strategies, month-to-month reporting can be too often to provide any meaningful data, while PPC campaigns might require more frequent checks.
What tools are available for reporting?
At Beanstalk, we are big fans of Google Data Studio, which allows us to combine metrics from tons of different data sources into one comprehensive report. For most websites, Google Analytics is a great place to start analyzing your website’s main data. Your CRM software can help you match names with the metrics and figure out the value of each marketing channel. Beyond that, there are endless tools for reporting and measuring marketing success. These should provide a sufficient basis for most companies to get started.
Is It Time to Consider a Marketing Pivot?
Again, the answer depends on your strategy and marketing channels. When it comes to data-driven digital marketing services, you should expect to see results from paid efforts a lot sooner than organic efforts. While organic efforts may only begin to generate results after several weeks or months, with paid efforts, you should see results more quickly. But before you go changing up your strategy completely, look for obvious areas for improvement. Sometimes even a simple change can be a game-changer, so make sure you’ve exhausted all options before throwing in the towel.
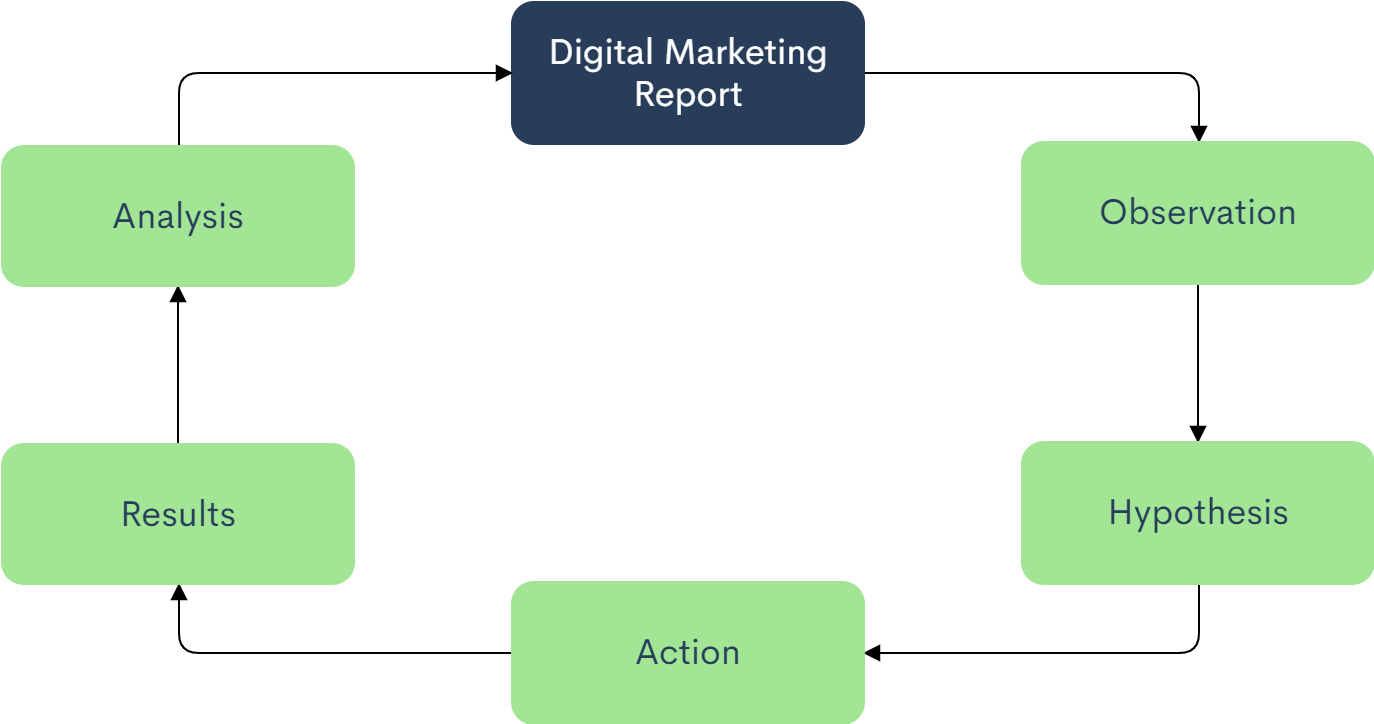
How Do I Make Data-Driven Decisions from My Reports?
The best way to make data-driven digital marketing decisions is to view your report as both a summary of what has been done and a jumping-off point for future marketing efforts. Making data-driven decisions is a systematic process. Professional digital marketers use reports to make observations. From those observations, we make a hypothesis, which we test with an actionable change. From there, results follow, which we analyze and report on, and the process begins again.
Ever felt overwhelmed by your digital marketing reporting or struggled to understand what the metrics really imply? We get it. It’s why we focus on data-driven digital marketing services that deliver tangible results. If you have any questions about your digital marketing reports, talk to us! We’ll help you find a solution that allows you to get the actionable insights you need without getting overwhelmed.